
Flexible Pricing, Flexible Options, No Minimums or Maximums
 Some diversity assessment tools have a minimum number of participants and an inclusion and a diversity assessment cost associated with each individual self-assessment. Spectra Diversity has neither a minimum nor a maximum number of people who may participate in the assessment. Discount pricing is available for our Spectra Diversity Partners.
We also offer a wide range of options such as custom sub-categories, open-ended questions, demographics and flexible start and stop dates. Participants can get their Individual Reports delivered to their home or business email immediately after completing the Spectra Assessment or just prior to training.

Diversity Assessment Cost with Standard Reports
Spectra Diversity also offers several different pricing options for Spectra Diversity Partners and non-partners.
Download the Assessment pricing 2025 PDF to see the pricing of the Spectra Assessment and other products and services we offer.
The Spectra Diversity Inclusion Assessment standard reports can be read in detail and can also be scanned for “big picture” messages. Here’s what’s included with every Spectra Assessment:
Standard Individual Report – Cost Included
The Individual Report shows participants where they rank on their Beliefs and Interpersonal Skills. Each question includes an interpretation and guideline for actions and behaviors that support an inclusive culture. The Individual Report can be sent upon completing the assessment or it can be sent out by Spectra Diversity prior to training.
The Individual Report also contains a section for the Organization Report results. Intentionally left unscored, this information would be shared with participants by the organization either during a training session or when the Spectra Assessment has been completed.
Download the Sample IND Report PDF
Standard Organization Report – Cost Included
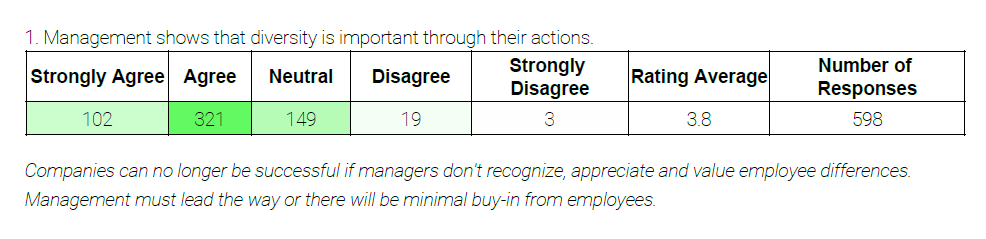
The Organization Report shows the mean, median and mode of each diversity and inclusion statement. The darker green color corresponds to the frequency of the response. In this example, the rating average alone (3.8) does not tell the complete story. 423 respondents agreed or strongly agreed (good news) while 22 disagreed or strongly disagreed. As a baseline diversity assessment tool, the Organization Report can provide a valuable benchmark for organizations of any size. The Enhanced Data Analysis would provide additional detail for organizations with 100 or more individuals.
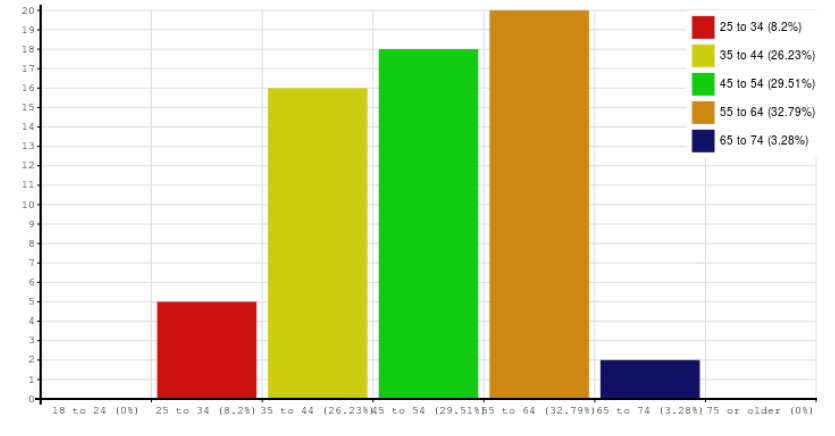
 Pie charts and bar graphs show the five demographic dimensions measured by the Spectra Assessment. In this example, the age chart shows that this small organization (61 people) has a potential issue with their talent pipeline as baby boomers retire. They may already understand this intuitively, and the Standard Organization Report confirms it with data.
Check out the Standard ORG Report Financial or the ORG Report Construction