Many organizations have prematurely dropped their DEI efforts, even though Trump’s DEI executive orders do not affect them.

Diversity and Inclusion: Moving in Which Direction?
Are We Making D&I Progress?
One of the meaningful ways in which diversity and inclusion can be improved in an organization, is to measure progress. That progress must begin with a baseline at some point in time. The Spectra Diversity Inclusion Assessment™ is one such measurement. Another one is undertaken by the U.S. Economic Employment Opportunity Commission. The EEOC took its baseline measurements many years ago, and is now measuring progress – or the lack thereof.
EEOC Enforcement and Litigation Data
The EEOC’s new data regarding litigation for EEOC violations was just released for 2016, and includes LGBT data.
EEOC resolved 1,650 charges and recovered $4.4 million for LGBT individuals EEOC who filed sex discrimination charges with EEOC in fiscal year 2016. Additionally, the data show a steady increase in the four years the agency has been collecting LGBT charge data. From fiscal year 2013 through fiscal year 2016, nearly 4,000 charges were filed with EEOC by LGBT individuals alleging sex discrimination, and EEOC recovered $10.8 million for victims of discrimination.
Whether more people are reporting violations, and thus litigating, or there are simply more violations is not known. What is known is that EEOC violations are up. Specifically, the charge numbers show the following breakdowns by bases alleged, in descending order:
- Retaliation: 42,018 (45.9 percent of all charges filed)
- Race: 32,309 (35.3 percent)
- Disability: 28,073 (30.7 percent)
- Sex: 26,934 (29.4 percent)
- Age: 20,857 (22.8 percent)
- National Origin: 9,840 (10.8 percent)
- Religion: 3,825 (4.2 percent)
- Color: 3,102 (3.4 percent)
- Equal Pay Act: 1,075 (1.2 percent)
- Genetic Information Non-Discrimination Act: 238 (.3 percent)
The numbers add up to more than 100% because in some cases, multiple charges were filed for a single incident or individual.
Diversity and Inclusion Maturity Model
Spectra Diversity has a Maturity Model, shown below. Those organizations who are involved in EEOC violations, are more likely at the lower end of the model. For example, organizations who are at the “Comply” level follow basic federally mandated anti-discrimination law to avoid negative consequences. They may focus is on treating everybody the same way and tend to be reactive, and often stop any diversity and inclusion initiatives once they are in legal compliance.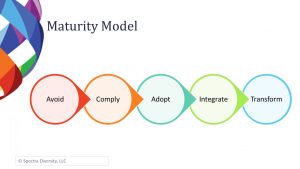
To learn where your organization is on the Maturity Model, consider using the Spectra Diversity and Inclusion Profile as a means of establishing a baseline.
Source: EEOC Releases Fiscal Year 2016 Enforcement and Litigation Data, Jan. 18, 2017
Related Posts